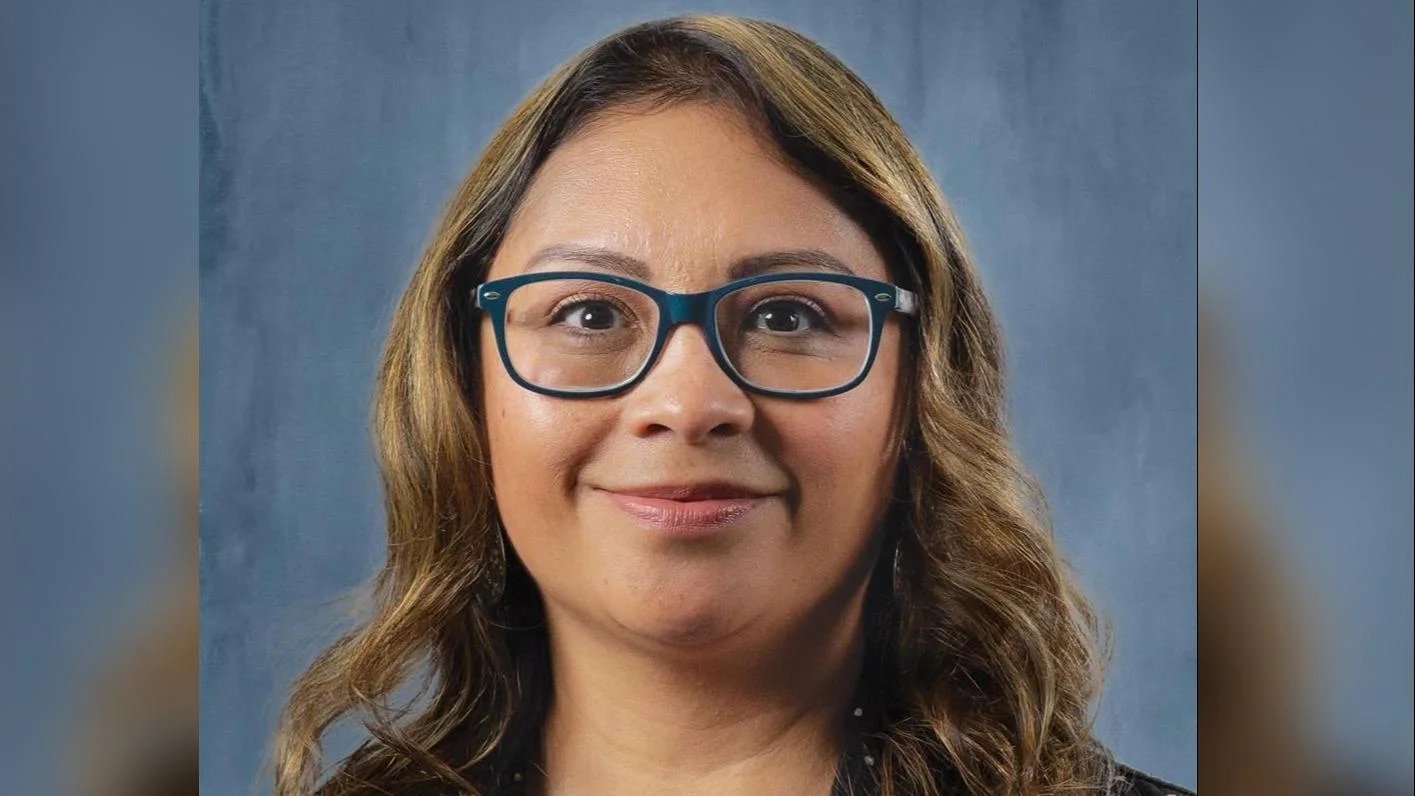
Marlene Muñoz Principal of Lakewood School | Official Website
Marlene Muñoz Principal of Lakewood School | Official Website
Of the 81,968 students attending Kane County schools, 45.9% were Hispanic. white students were the second largest ethnicity, making up 40.1% of Kane County students.
In the previous school year, Hispanic students were also the most common group in Kane County, representing 45.5% of the student body.
South Elgin High School had the most even distribution of races among county schools, including 40.4% white students, 38% Hispanic students, 11.3% Asian students, 5.1% African American students, 4.5% multiracial students, and 0.5% American Indian students.
The Illinois State Board of Education’s budget for fiscal year 2026 will increase from nearly $10.8 billion to about $11.2 billion. This includes a $307 million boost for K–12 schools, marking the smallest annual increase since 2020.
The agency has paused about $50 million in funding previously allocated through the Evidence-Based Funding formula for the Property Tax Relief Grant while reviewing its impact on local tax relief. Officials say the pause could affect the timing and amount of property tax relief available to taxpayers.
| School name | Most prevalent ethnicity | Percent of Total Student Body | Total Enrollment |
|---|---|---|---|
| Abbott Middle School | Hispanic | 75.2% | 549 |
| Algonquin Lakes Elementary School | White | 44.3% | 379 |
| Alice Gustafson Elementary School | White | 78.4% | 487 |
| Anderson Elementary School | White | 63.9% | 443 |
| Batavia Senior High School | White | 76.8% | 1,710 |
| Beaupre Elementary School | Hispanic | 95.8% | 165 |
| Bell-Graham Elementary School | White | 79.7% | 472 |
| Benavides STEAM Academy | Hispanic | 86.1% | 316 |
| C.F. Simmons Middle School | Hispanic | 91.4% | 729 |
| C.I. Johnson Elementary School | Hispanic | 85.6% | 271 |
| C.M. Bardwell Elementary School | Hispanic | 92.6% | 598 |
| Cambridge Lakes Charter School | White | 39.8% | 620 |
| Carpentersville Middle School | Hispanic | 89.3% | 1,086 |
| Central High School | White | 60% | 1,432 |
| Central Middle School | White | 59.3% | 403 |
| Century Oaks Elementary School | Hispanic | 71.8% | 422 |
| Channing Memorial Elementary School | Hispanic | 85.2% | 480 |
| Clinton Elementary School | White | 51.5% | 487 |
| Coleman Elementary School | Hispanic | 86.5% | 550 |
| Corron Elementary School | White | 60.8% | 525 |
| Country Trails Elementary School | White | 53.5% | 688 |
| Creekside Elementary School | Hispanic | 63% | 478 |
| Davis Primary School | White | 56.7% | 397 |
| Dundee Highlands Elementary School | White | 52.8% | 339 |
| Dundee Middle School | White | 55.4% | 1,178 |
| Dundee-Crown High School | Hispanic | 68.3% | 2,377 |
| East High School | Hispanic | 89.5% | 3,907 |
| Edna Rollins Elementary School | Hispanic | 85.8% | 492 |
| Elgin Math and Science Academy Charter School | Hispanic | 43.8% | 463 |
| Ellis Middle School | Hispanic | 86.8% | 555 |
| Fabyan Elementary School | White | 79.1% | 235 |
| Fearn Elementary School | White | 49.7% | 467 |
| Ferson Creek School | White | 82.2% | 580 |
| Fox Meadow Elementary School | White | 45.6% | 425 |
| Fred Rodgers Magnet Academy | Hispanic | 88.3% | 281 |
| Freeman Elementary School | Hispanic | 48.9% | 542 |
| G.N. Dieterich Elementary School | Hispanic | 88.9% | 440 |
| Gary D. Wright Elementary School | White | 60.2% | 659 |
| Geneva Community High School | White | 82.9% | 1,593 |
| Geneva Middle School North | White | 81.8% | 598 |
| Geneva Middle School South | White | 83.2% | 590 |
| Gilberts Elementary School | White | 64.4% | 697 |
| Golfview Elementary School | Hispanic | 96.3% | 382 |
| Goodwin Elementary School | Hispanic | 40.8% | 309 |
| Grace McWayne Elementary School | White | 82.5% | 348 |
| Greenman Elementary School | Hispanic | 74.6% | 536 |
| H.C. Storm Elementary School | White | 69% | 339 |
| Hall Elementary School | Hispanic | 65.4% | 529 |
| Hampshire Elementary School | White | 75% | 428 |
| Hampshire High School | White | 56.7% | 1,889 |
| Hampshire Middle School | White | 59.8% | 803 |
| Harriet Gifford Elementary School | Hispanic | 69.5% | 380 |
| Harrison Street Elementary School | White | 72.3% | 386 |
| Heartland Elementary School | White | 84.9% | 317 |
| Henry W. Cowherd Middle School | Hispanic | 84.5% | 843 |
| Herget Middle School | Hispanic | 58.9% | 572 |
| Highland Elementary School | Hispanic | 78.6% | 562 |
| Hill Elementary School | Hispanic | 79.3% | 550 |
| Hillcrest Elementary School | Hispanic | 76.2% | 446 |
| Hinckley-Big Rock Middle School | White | 83.6% | 146 |
| Hoover Wood Elementary School | White | 67.3% | 343 |
| Howard B. Thomas Grade School | White | 50.7% | 639 |
| Illinois Mathematics and Science Academy | Asian | 47% | 630 |
| Illinois Youth Center - St. Charles | African American | 53.1% | 32 |
| J.B. Nelson Elementary School | White | 66.9% | 426 |
| Jefferson Middle School | Hispanic | 74.2% | 551 |
| Jewel Middle School | Hispanic | 53% | 525 |
| John Gates Elementary School | Hispanic | 93.6% | 409 |
| K.D. Waldo Middle School | Hispanic | 88% | 784 |
| Kaneland Blackberry Creek Elementary | White | 83.1% | 491 |
| Kaneland Harter Middle School | White | 78.1% | 812 |
| Kaneland John Shields Elementary School | White | 81.2% | 394 |
| Kaneland John Stewart Elementary School | White | 79.2% | 438 |
| Kaneland McDole Elementary School | White | 61.6% | 419 |
| Kaneland Senior High School | White | 76.7% | 1,228 |
| Kenyon Woods Middle School | White | 41.4% | 749 |
| Kimball Middle School | Hispanic | 75.5% | 550 |
| L.D. Brady Elementary School | Hispanic | 92.1% | 265 |
| Lakewood School | Hispanic | 96.6% | 496 |
| Larkin High School | Hispanic | 73.6% | 2,075 |
| Larsen Middle School | Hispanic | 80.1% | 527 |
| Liberty Elementary School | White | 44.8% | 727 |
| Lily Lake Grade School | White | 80.4% | 270 |
| Louise White Elementary School | White | 79.5% | 385 |
| Lowrie Elementary School | Hispanic | 86.2% | 326 |
| Mabel O. Donnell Elementary School | Hispanic | 75.4% | 374 |
| McCleery Elementary School | Hispanic | 72.6% | 581 |
| McKinley Elementary School | Hispanic | 85.6% | 353 |
| Meadowdale Elementary School | Hispanic | 98.1% | 412 |
| Mill Creek School | White | 81.5% | 373 |
| Munhall Elementary School | White | 77.6% | 501 |
| Nicholas A. Hermes Elementary School | Hispanic | 89% | 538 |
| Nicholson Elementary School | Hispanic | 74.1% | 321 |
| Oak Park Elementary School | Hispanic | 96.2% | 446 |
| Olney C. Allen Elementary School | Hispanic | 65.6% | 596 |
| Otter Creek Elementary School | Hispanic | 64.5% | 684 |
| Parkview Elementary School | Hispanic | 61.1% | 535 |
| Perry Elementary School | Hispanic | 69.6% | 227 |
| Prairie Knolls Middle School | White | 60.5% | 767 |
| Prairie View Grade School | White | 60.8% | 673 |
| Richmond Intermediate School | White | 54.8% | 356 |
| Ronald D.O. Neal Elementary School | Hispanic | 86.1% | 453 |
| Rose E. Krug Elementary School | Hispanic | 83.3% | 252 |
| Saint Charles East High School | White | 69.7% | 1,886 |
| Saint Charles North High School | White | 72.5% | 1,802 |
| Sam Rotolo Middle School | White | 76.8% | 1,094 |
| Schneider Elementary School | Hispanic | 64.4% | 348 |
| Sleepy Hollow Elementary School | White | 51.1% | 399 |
| Smith Elementary School | Hispanic | 71.7% | 396 |
| South Elgin High School | White | 40.4% | 2,750 |
| Sunny Hill Elementary School | Hispanic | 82.8% | 250 |
| Thompson Middle School | White | 71.2% | 1,275 |
| Wasco Elementary School | White | 85.9% | 417 |
| Washington Elementary School | Hispanic | 71.9% | 374 |
| Washington Middle School | Hispanic | 67.3% | 663 |
| West Aurora High School | Hispanic | 62.6% | 3,317 |
| Western Avenue Elementary School | White | 88.6% | 341 |
| Westfield Community School | White | 59.7% | 1,321 |
| Wild Rose Elementary School | White | 79.5% | 537 |
| Willard Elementary School | Hispanic | 42.9% | 240 |
| Williamsburg Elementary School | White | 85% | 448 |
| Wredling Middle School | White | 68.9% | 1,307 |
Information in this story was obtained from the Illinois State Board of Education. The source data can be found here.


 Alerts Sign-up